
Analyzing the graphs of lost equipment allows us to highlight the different phases of the war and determine changes in the tactics of the Russian army.
Thanks to the Oryx project, which collects and categorizes all video and photo evidence of destroyed and captured military equipment, it is possible to make well-founded conclusions about the course of the war. As the authors of the project say: "Only destroyed equipment, means, and equipment, confirmed by photos or videos belong to the list. Therefore, the actual amount of destroyed equipment significantly exceeds what is on the list."
Some military analysts also note that the amount of the equipment in the video and photo can be distorted in some way (the Ukrainian information policy is not to show all losses). However, one can use not absolute numbers (they are incomplete anyway), but a ratio between the number of losses in Russian and Ukrainian reports. This ratio allows us to draw some interesting conclusions.
1. Overall casualties and the loss of armored vehicles
Let's start with a general graph of all losses for the entire period of hostilities (graphs from Lee Drake):
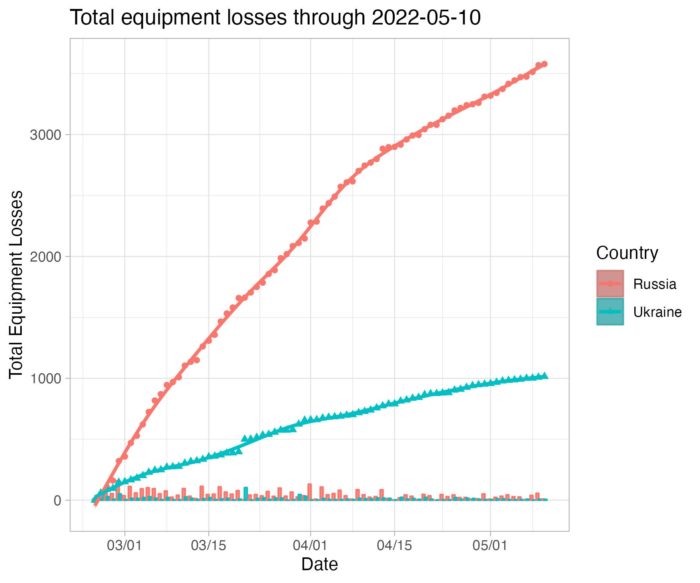
The graph shows that Russia followed two approaches in its hostilities:
- after the first two weeks when the intensity of losses (the slope on the curve on the graph) was the highest (when the Russians moved in columns deep into the territory of Ukraine, which left a lot of destroyed and abandoned equipment), as well as in the beginning of the offensive in the East (early April);
- in April-May, the intensity of losses of the Russian equipment fell, which reflects a change in tactics – the Russians are trying to avoid contact battles and more often use long-range artillery strikes.
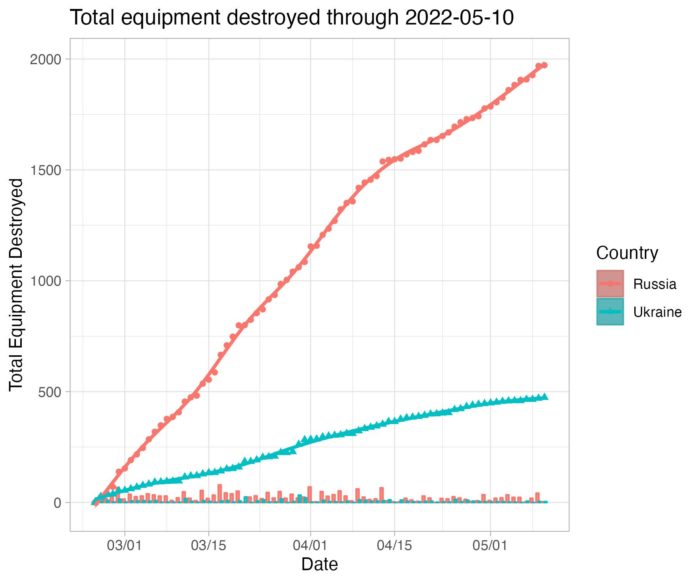
The graph of destroyed equipment confirms this theory: the growth rate of the number of destroyed equipment has fallen since the second week of April.
Another interesting graph is the percentage ratio between Russian and Ukrainian equipment lost. Pay attention to the lower right graph, which shows the ratio of total losses.
It is again noticeable that with the change in tactics in the East, the Russian army suffered smaller losses for a certain time (as a percentage), but recently Ukrainian troops seem to have adapted and now, the ratio has almost returned to the previous level: one unit of Ukrainian equipment to three units of Russian ones (25% and 75%).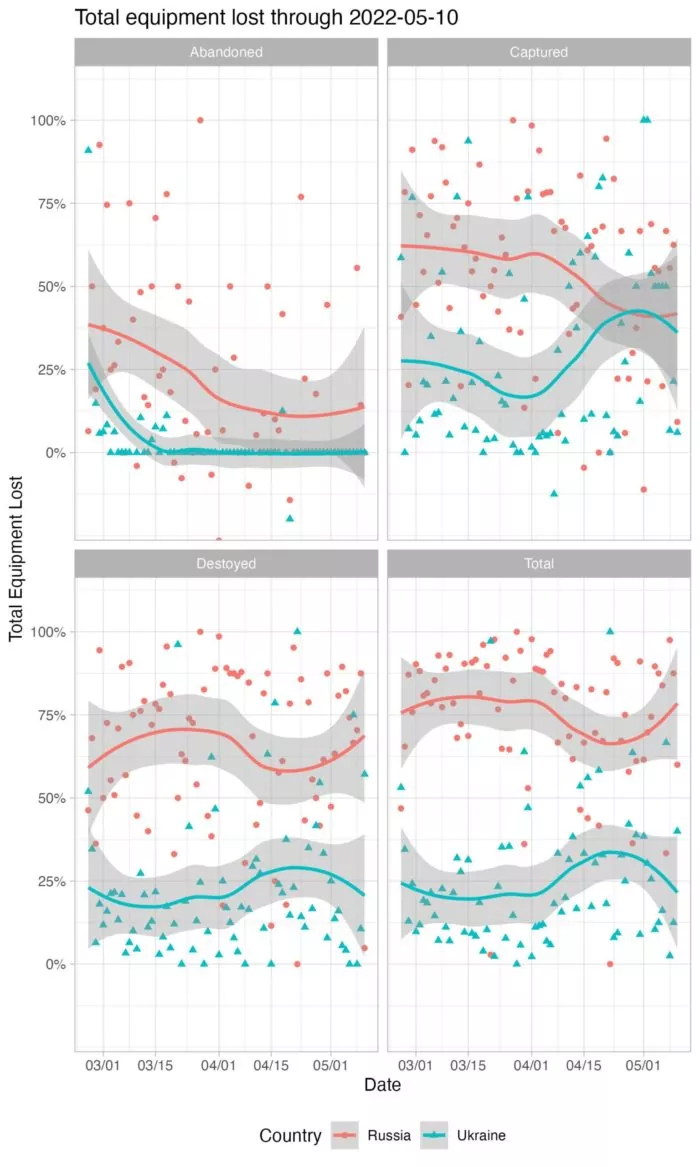
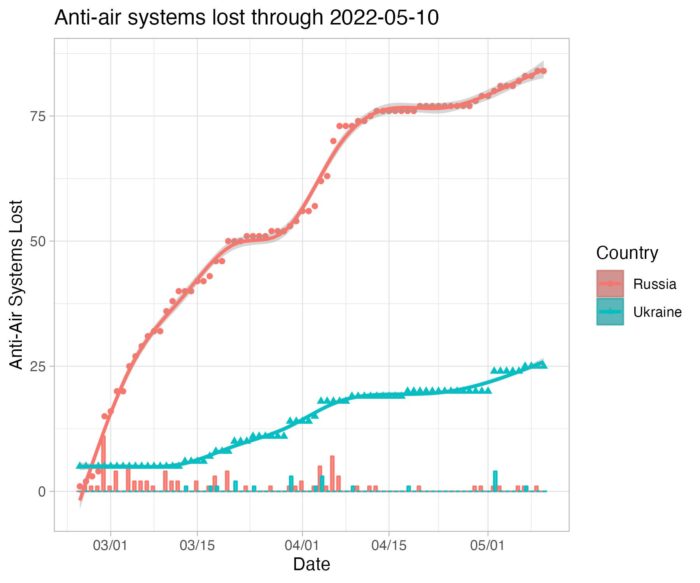
2. Aviation and air defense
From these graphs, one can not only see the different dynamics/different phases of the war and the ratios (it is obvious that Ukraine destroys Russian aircraft faster than air defense systems) but also draw the main conclusion – after two months of the war, the Russians could not dominate the sky.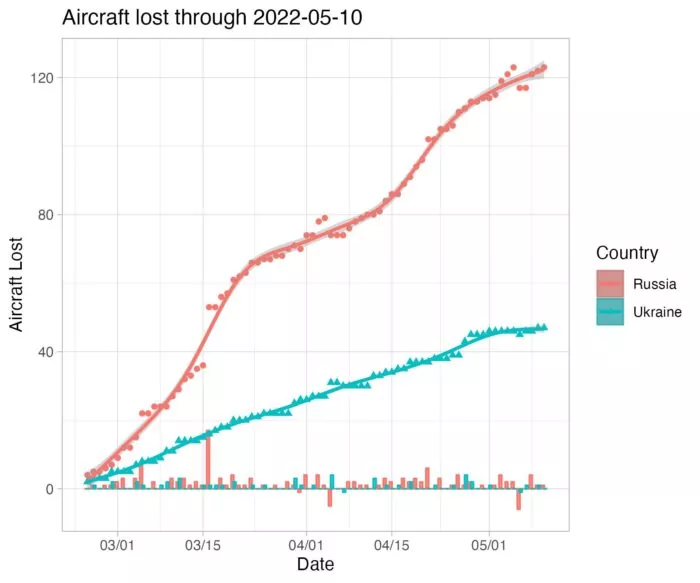
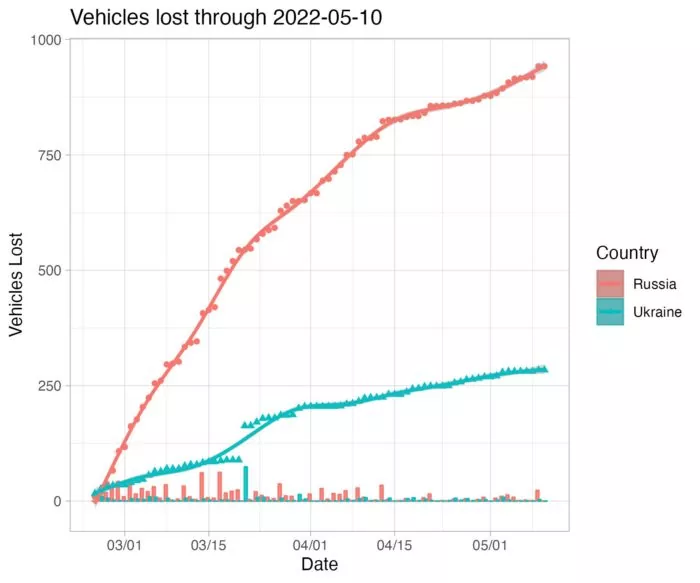
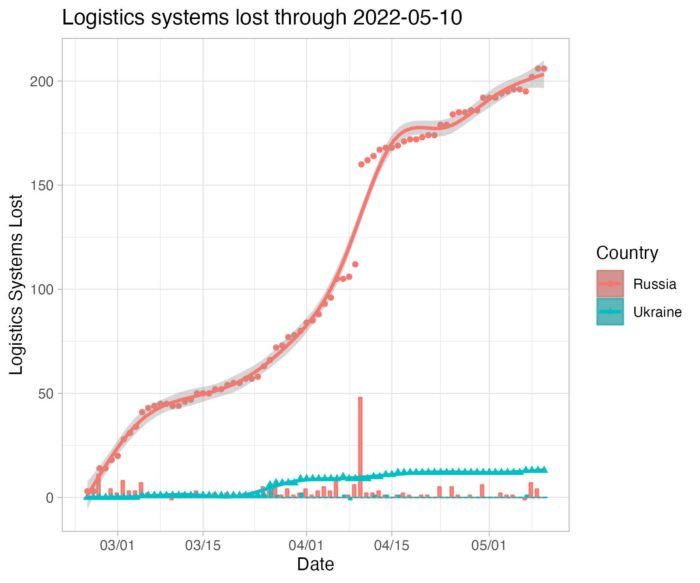
3. Logistics
Finally, the graphs for logistics and vehicles clearly show where the main efforts of the Ukrainian Army are targeted: for trucks, the ratio is 1 to 4, and for logistics systems – something like 1 to 15 in favor of Ukrainian forces.
As a conclusion to the previous two graphs, this diagram illustrates the main tactical preference of the Ukrainian forces: a strike on enemy logistics. The most successful ratio, 1:15 in Ukraine's favor, is in the logistics. Ukraine's ratio is the worst with aviation, but even there the coefficient is approximately 1:2.5 - for each of its aircraft shot down, Ukraine takes down 2.5 Russian ones.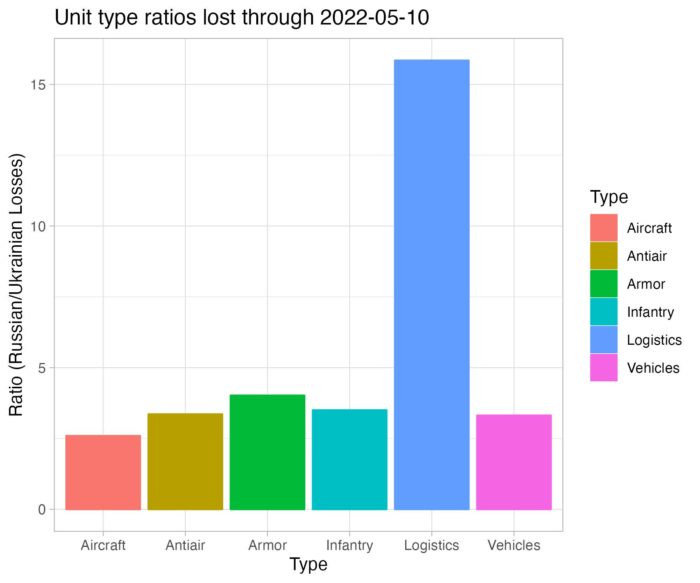
More charts from Lee Drake can be viewed on his page.
A table with the number of losses is here.
Related:
- Azov fighter Illia in Mariupol: “For the Azov Regiment, captivity means certain death”
- Battle of Donbas: Russian attempt to encircle Ukrainian troops, in maps
- NATO: Collective Defense or Collective Denial?
- Snyder: Ten reasons Ukraine should win the war
- Why arming Ukraine won’t cause World War Three: expert opinion
- Trophy dog abandoned by Russian army learning to obey commands in Ukrainian
- Not enough weapons, not enough Russian sanctions: opinion poll


