Moreover, at the level of districts, how Ukrainians vote is often explained not by linguistic, ethnic, socio-economic variables but by local political elites striking a deal with larger political forces.
Here we publish the abridged translation of Texty’s research. The original is available in Ukrainian with all data plotted on interactive maps and diagrams showing the overall dynamics in the country and its provinces.
This is how Ukrainians vote, in popular opinion: traditionally, a high level of support for national democratic forces is in the west and the center of Ukraine, while pro-Russian and communist forces are popular in the east and south. But is it really so?
Texty.org.ua conventionally divided all the parties that participated in the parliamentary elections from 2006 throughout 2019 into three types:
- national democratic parties (typical examples: Yushchenko’s Our Ukraine, Poroshenko Bloc);
- pro-Russian or communist parties (Yanukovych’s Party of Regions, Communist Party of Ukraine - CPU);
- populist parties (Yuliya Tymoshenko Bloc - BYuT, Zelenskyy's Servant of the People).
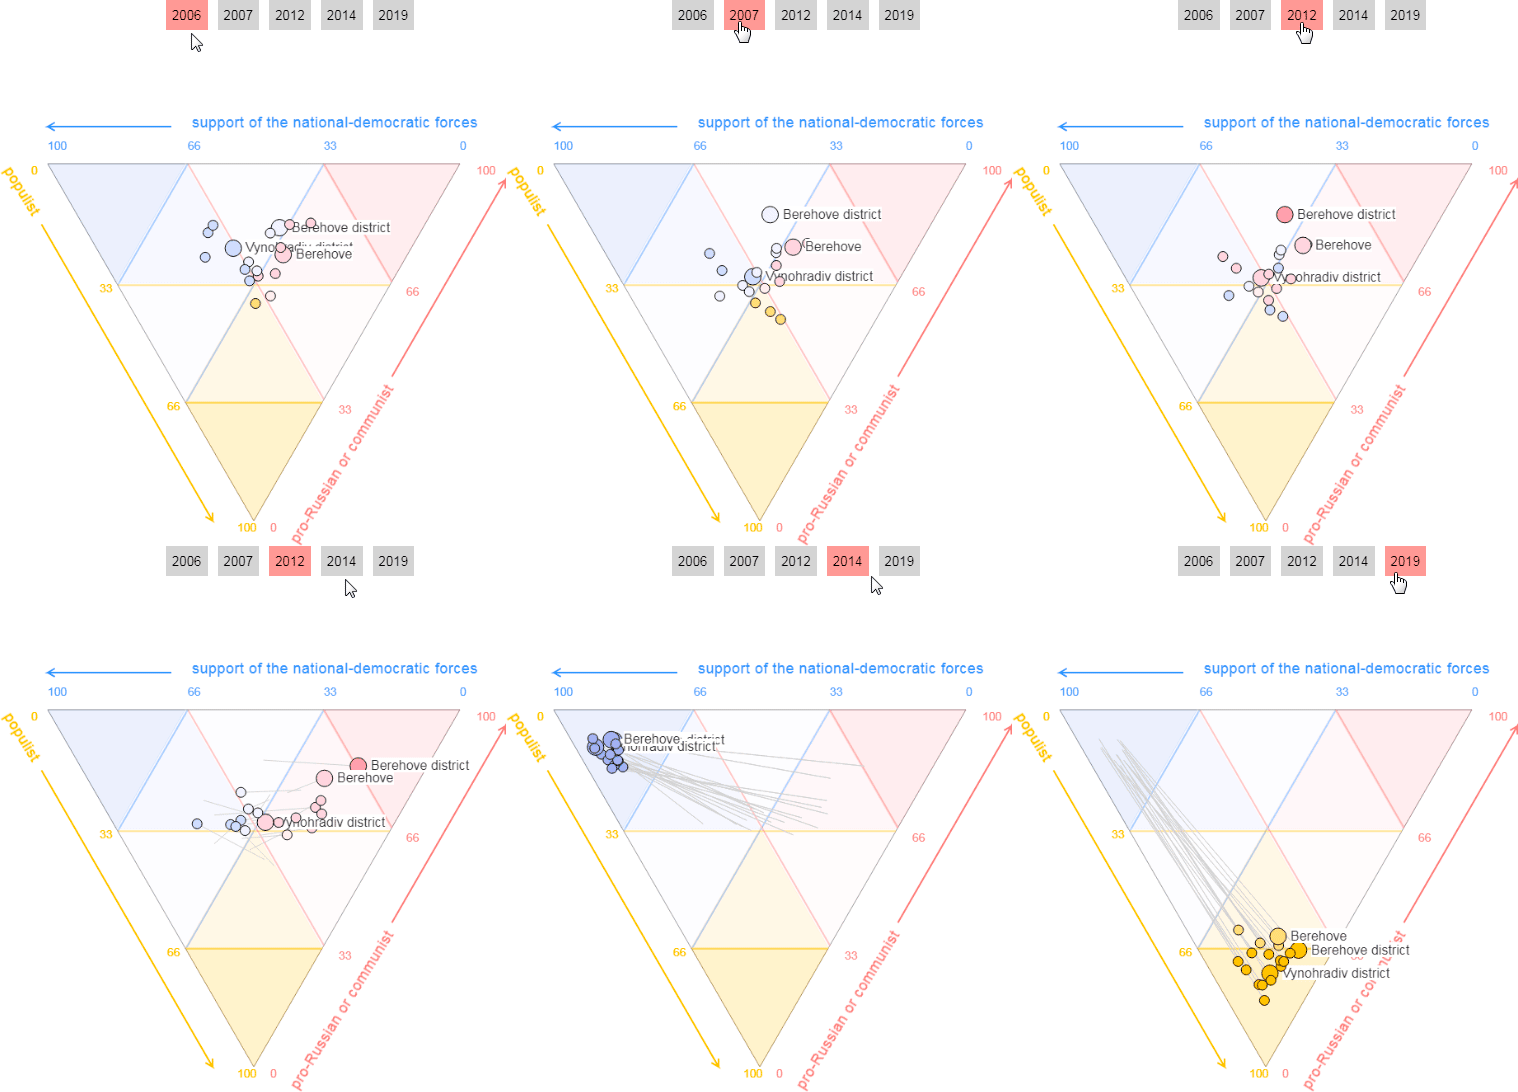
For example, if a political actor of each type won 33.3%, we end up placing the dot in the middle of the triangle (the white dot in the center). This is a rare occasion and, most likely, some actors will have more support so that the point will shift, respectively, in the direction of the blue, yellow, or red corner:

These deviations from the "center" for each polling station in the elections to the Verkhovna Rada are marked on the map by vector arrows that extend from the center of the conventional triangles. The higher the percentage in votes for a particular type of a political force, the longer and more directed to the appropriate angle the line is. For a quick reference, you can simply follow a color.
In general, both the slope and the color of the lines show the ratio of votes received by the parties in these three directions: the “westbound” slope to the left with the blue arrows show the national democratic parties; the “eastbound” slope to the right in red depicts pro-Russians; the yellow one leaning down means populists. Every line shows one polling station.


If you aggregate the data of polling stations to the level of cities and districts, you can distinguish these patterns more clearly.
It's not only “East” and “West”
Throughout 2006-2019, three oblasts of the historic Halychyna region - Lviv, Ivano-Frankivsk, Ternopil - and two Donbas oblasts - Donetsk and Luhansk - had the smallest internal changes in party support.
At the same time, in some locations, districts had greater differences in electoral preferences than oblasts.
This is how the political preferences of the districts and the largest cities of Ukraine look like in the triangle. Some points fall out of the general picture, these are the so-called outliers with rates that differ sharply: here in a consistent manner they vote differently than the rest of the oblast does. Zakarpattia, Chernivtsi, Chernihiv, Sumy, and Zhytomyr oblasts had the largest intra-regional deviations.

“Ethno-political entrepreneurship”
In the case of Chernivtsi and Zakarpattia oblasts, these are the districts with the largest shares of ethnic minorities.
For example, let’s check Zakarpattia oblast. In the Berehove district, three-quarters of the population are ethnic Hungarians, and the town of Berehove has about half of the ethnic Hungarian population. These have the lowest level of support for "national democratic" actors, which was effectively used by the Party of Regions in 2012. However, districts like Vynohradiv (one-quarter of the population are Hungarians) or Uzhhorod (one-third of the population) don’t have such voting trends:

A similar situation is in Chernivtsi Oblast where the support for "pro-Russian and communist forces" is manifested in Hertsa district with the majority of the ethnic Romanian population (about 90%), and Novoselytsia, where about 57% are Moldovans (a Romanian sub-ethnos, - Ed.) according to the latest census. Whereas Hlyboka district, where ethnic Romanians are a little less than half of the population, or Storozhynets with a third of them do not have similar voting results:

At the same time, the influence of ethnicity by itself is doubtful, without its use in the party's electoral strategy, access to administrative resources in the district, alliance with local elites, or the development of the local party cell.
This shows the importance of local politics rather than the reaction of national minorities to what is happening at the national level.
To denote this phenomenon, there exists the term ethnopolitical entrepreneurship. That is when ethnic boundaries are used to achieve political goals. In Ukraine, it looks like political forces are negotiating with the "right people" and getting votes, not because a particular ethnic community has its own strategy.
Historical borders
It is worth mentioning that the territory of Chernivtsi Oblast has long been divided between the Austrian and Russian empires. And this ancient border is still manifested on electoral maps. Electoral behavior in former parts of the Russian Empire is shifted toward "communist and pro-Russian" actors as compared to former Austria-Hungary. This adds to the diversity of the electoral geography of Chernivtsi together with ethnopolitical entrepreneurship.
Another example of the influence of historical borders are the northern districts of the Ternopil oblast, which were part of the Volyn province of the Russian Empire, as opposed to another part that belonged to the Austrian Empire. Interestingly, this line of demarcation became apparent only in 2012, when the Party of Regions managed to achieve strategic success in these areas as compared to the territories on the other side of the former border that is no longer physically present on electoral maps.
In the north of Sumy Oblast, the Seredyna-Buda District, which consistently has the largest support for pro-Russian forces in the oblast, has a small share of ethnic Russians but a high percentage of Russian-speaking residents (2001 census data). At the same time, Velyka Pysarivka District, which is the second-largest ethnic Russian and the third-largest Russian-speaking population, does not have such electoral preferences:

The same applies to the Chernihiv Oblast. Chernihiv has a larger Russian-speaking population than Semenivka District, but support for national democratic forces in Chernihiv is higher.
On the other hand, Zhytomyr Oblast (which does not have significant differences in population structure) is also one of the oblasts that show the largest intra-regional differences. The city of Korosten, for example, was a "red" fortress for 23 years, until the Communist Party was banned in Ukraine.
Linguistic, ethnic, socio-economic variables also have no explanatory force for many specific cases when we see the difference in the electoral behavior of cities and districts in one oblast.
For example, in Kharkiv and Kirovohrad oblasts, more ethnic Russians and Russian-speakers live in large cities, but in the 2006-2012 elections, we can see that Kropyvnytskyi and Svitlovodsk (Kirovohrad oblast), as well as Kharkiv and Lyubotyn, cast more votes for pro-Ukrainian political forces than the average in these areas.
If you look at the graphs by oblasts, you can see that the city of Horishni Plavni (formerly Komsomolsk) in 2006-2019 did not follow the electoral turn of the Poltava Oblast, but was the most loyal to the Party of Regions." Perhaps this is due to the fact that the city was created in Soviet times as a satellite of the large "Poltava Mining and Processing Plant," and there at the request of the Soviet authorities came many Komsomol (“Youth Communist Union”) volunteers, including from Russia. On 6 January 1961, the newspaper Komsomolskaya Pravda wrote, "There is the city of Komsomolsk-on-Amur, the city of Komsomolsk-on-Dnieper will appear," after which a campaign began to move young people to this new “construction project of the century.”
On the contrary, in 2006-2012 the city of Nikopol steadily showed the highest support of "national-democratic" forces in the Dnipropetrovsk Oblast.
The city of Slavutych (built for the families of Chernobyl workers, ethnic composition: Ukrainians - 44.3%; Russians - 45.8%; Belarusians - 4.8%) of Kyiv oblast in 2006-2012 also fell out of the regional trend and supported the Party of Regions.
The city of Yuzhnoukrainsk (like in Slavutych, people who work at an NPP - Pidenno-Ukrainian NPP - live here. Ethnic structure: Ukrainians - 73,9%; Russians - 21,7%; Belarusians - 0,7%;) the Mykolaiv area in 2006-2014 consistently showed the highest level of support for "national democratic" forces in the oblast.
Nedrigailiv district, where Viktor Yushchenko was born, also had record support for Our Ukraine in the Sumy Oblast in 2002-2007.
Read also:
- Reforms in Ukraine are increasingly stagnant, experts say
- 84% of Ukrainians believe in populist economic fairy tales
- How Zelenskyy “hacked” Ukraine’s elections | Op-ed
- Ukrainian prankers organize rent-a-mob rally in support of serial killer “presidential candidate”
- Fifty shades of Ukrainian populism: Tymoshenko, Zelenskyy, and the Chiaroscuro principle
- Digital populism of Ukrainian presidential campaign has inflicted a deep wound, Deresh says
- Should Ukraine take over the Russian language? Scrutinizing Prof. Snyder’s arguments
- Why Ukrainians keep voting for the wrong people


