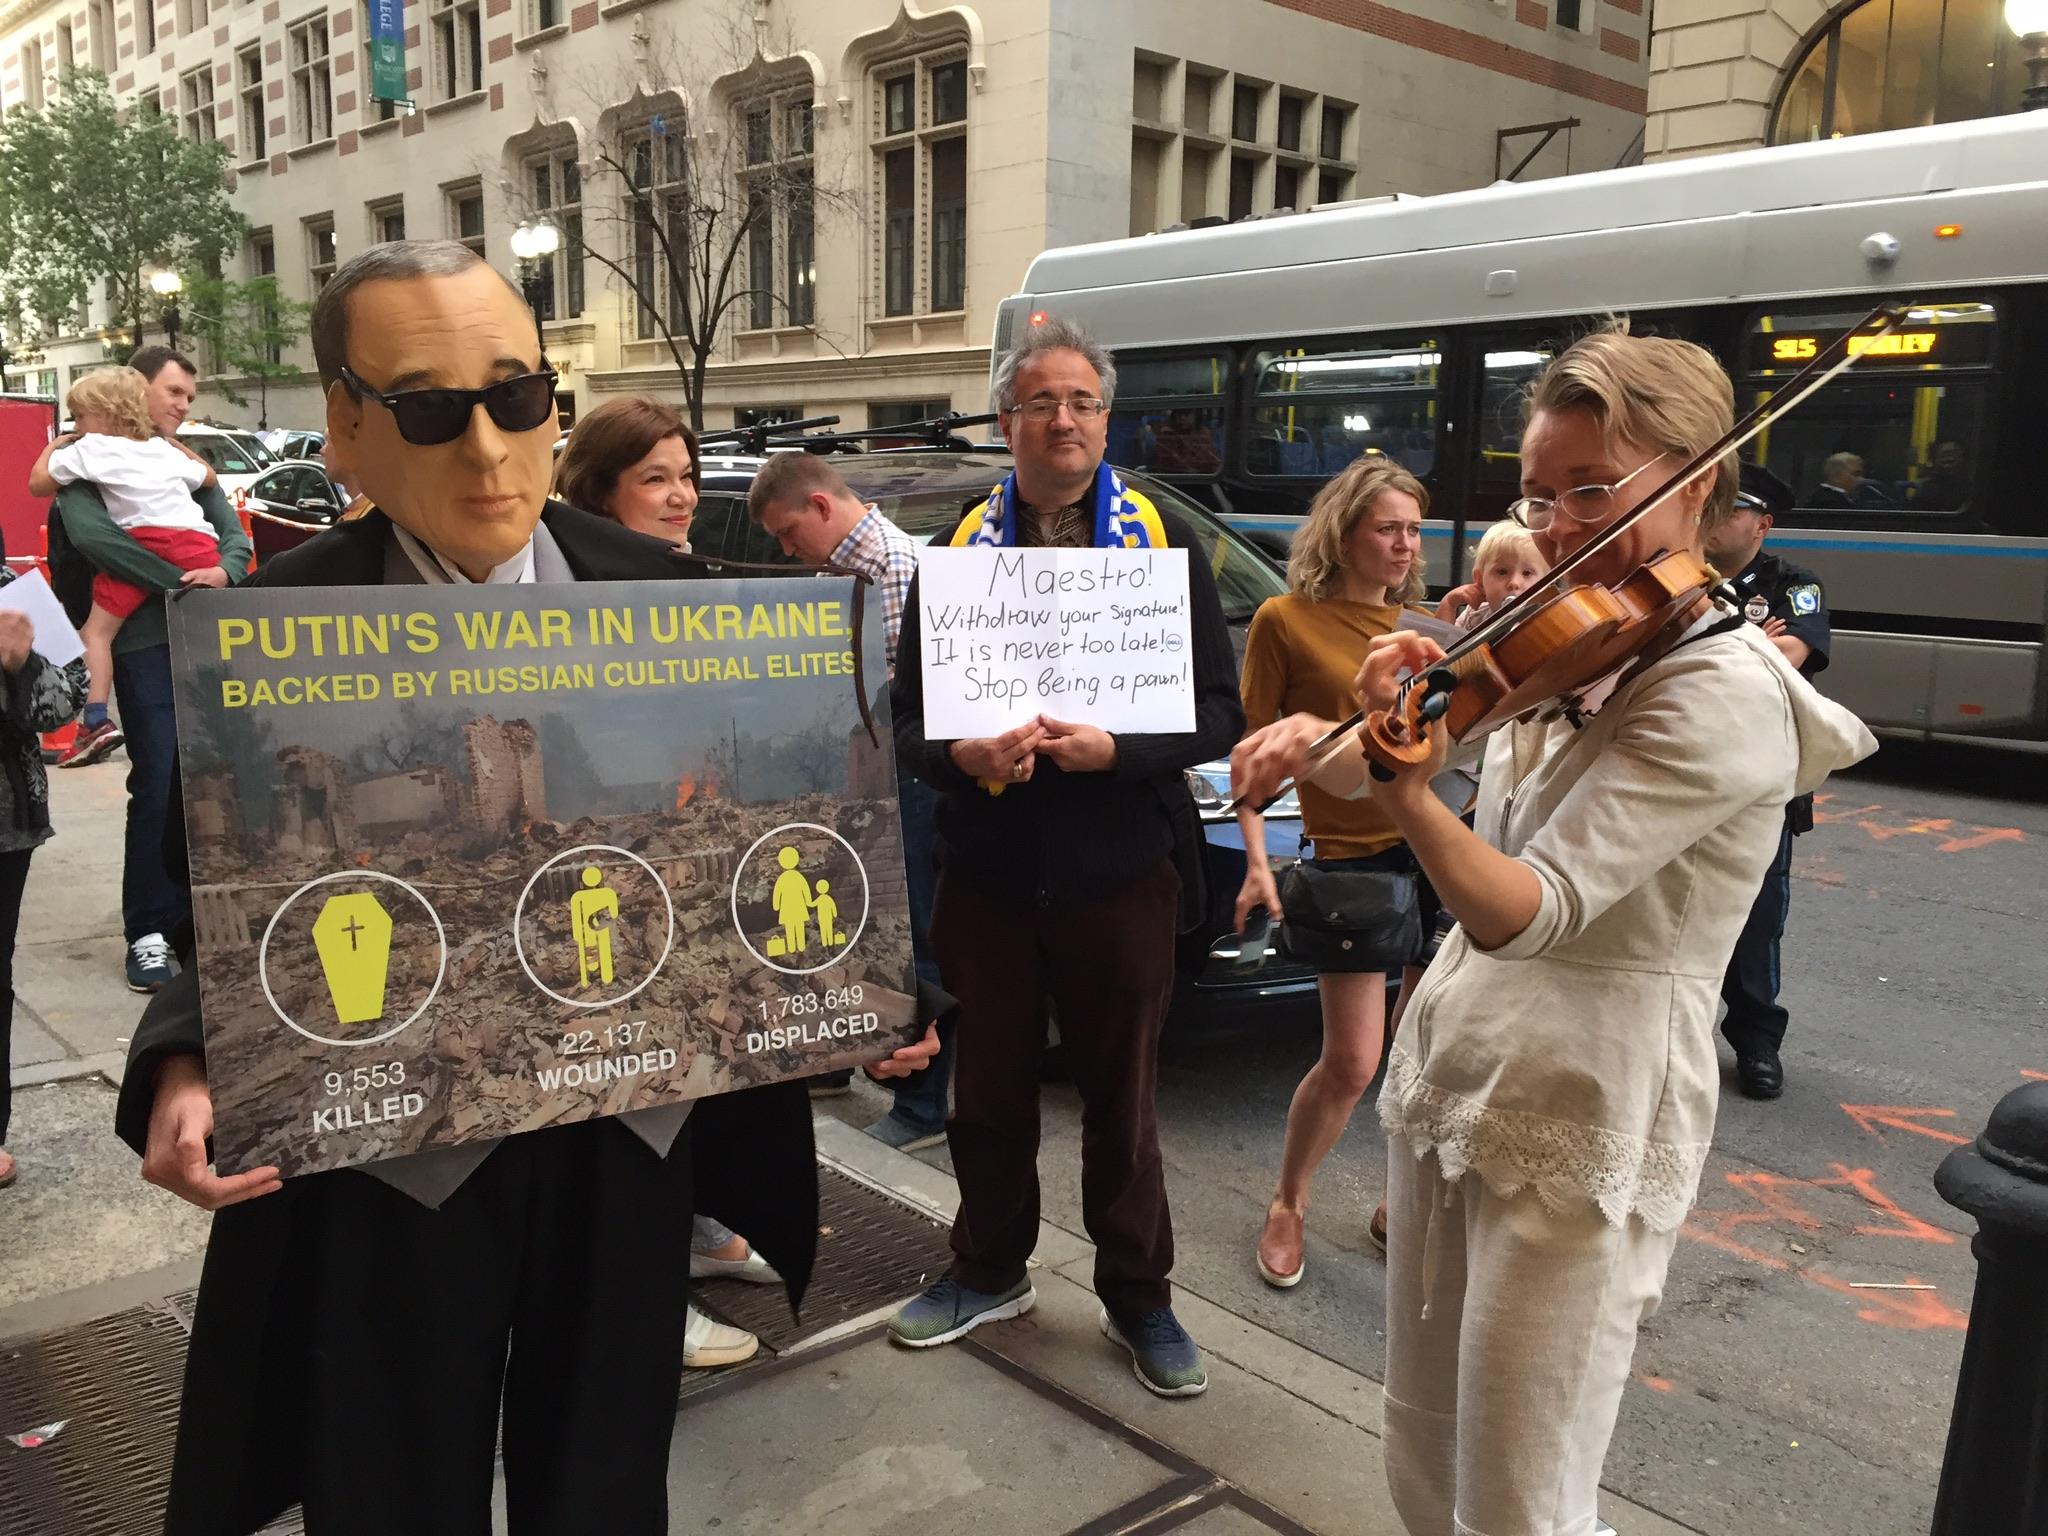

Can arts and graphics help stop Russia’s war in Ukraine? We think so, as it’s one of the most potent ways to transmit information. Check out these resources for making your own infographics that can help Ukraine by keeping Ukraine and the war Russia has waged in Donbas in the spotlight of international attention. If you are interested in making infographics, please contact us at euromaidanpress (a) gmail.com and we’ll be very happy to share them.
- Hohli Builder (http://charts.hohli.com/) – online tool for making nice diagrams and charts.
- Сreately (http://creately.com/) – allos to insert your data into readymade samples to make nice and professional infographics.
- Infogr.am (http://infogr.am/) – a sinple and useful tool for making interactive infographics.
- Piktochart (http://piktochart.com/) – several free adjustable samples for making your own infographics with over 200.000 users all over the world. The basic software is free.
- Visual.ly (http://visual.ly/) – free samlpes for making infographics, but essentially this is a library of neatly catagorized content from all over the world. Very inspirational!
- Google Charts (https://developers.google.com/chart/) – a tool for making nice and easily adjustable charts and diagrams using your data.
- Vizualize.me (http://vizualize.me/) – a tool, which tramsforms your LinkedIn-CV into infographics. Similar to a Russian language tool – Resumup.ru.
- Google Public Data Explorer (http://www.google.com/publicdata/directory) – an online search tool based on public statistical data from all over the world. You can research there, collect the data and transform it into infographics.
- Wordle (http://www.wordle.net/) – an old, but still a good working tool for making effective text visualisations. You enter your text and it produces a “cloud” with the most mentioned words.
- Inkscape (http://inkscape.org/en/) – graphic editor similar to Illustrator and CorellDraw with lots of features. A link to tutorials can be found on the official webite.
- Tagxedo (http://www.tagxedo.com/) visualises, i.e. trasnforms text (public speaches, news articles, slogans etc.) into “clouds” with text.
- Cacoo (https://cacoo.com/) – online tool for painting, which allows to make various types of infographics, including website maps, webpage schemes, UML (Unified Modeling Language) and network graphics. The tool allows real-time teamwork, i.e. several users can share among themselves and/or add to blog the same diagram at the same time.
- Canva (https://www.canva.com/create/
infographics/) – a simple, drag-and-drop, design software that’s completely online and free to use. They have been around for just slightly over year and already have 1.4 million users.